Business Intelligence
Bissantz Delta Master
DVA Information and Telecomm cations has collaborated with Bissantz (https://www.bissantz.com/#deltamaster) from Germany to introduce DeltaMaster Business Intelligence to the Turkish market.
It’s the fnal stretch of the process that determines whether Business Intelligence makes an impact – or not. After all, if people don’t read reports, understand them, and take appropriate actions, all of the time and effort spent collecting, saving, and preparing data was for nothing. The conditions for human perception are complex, but not as individual as you might think. We have focused on these common traits and used them to design information systems.
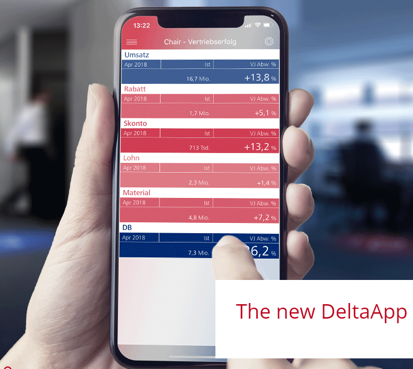
Universal standards for reports and analyses trigger signals that communicate variances and management information faster and clearer than ever before. That’s just one reason why the best-managed companies steer their business performance with DeltaMaster. There are many others.

Most commonly used chart types are outdated, skimpy, and poorly done. Time series that use a linear scale are often deceiving. Pie charts are difficult to read. Bars and columns simply do not cope well when the values have a broad range.
All of them need large spaces to display small amounts of information. It’s no wonder. The Scottish engineer and economist William Playfair invented charts over two centuries ago and not much has changed since then.
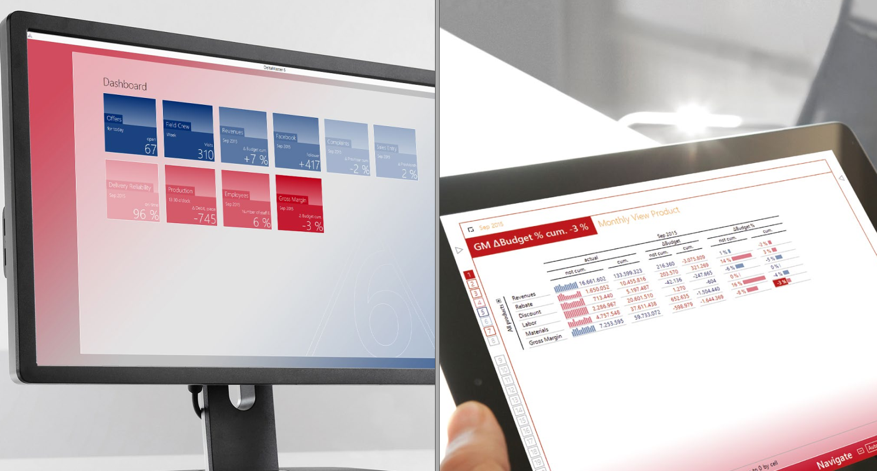
Today’s decision-makers, however, are starving for information. That’s why DeltaMaster works extensively with graphic tables. This trustworthy, data-dense format complements the numerical values in a pivot table with bars, columns, circles, or sparklines.
Graphic tables combine the tidiness of a table with the attractiveness of a chart. Tables are compact, data dense as well as easy to understand and read. Graphics grab your attention, communicate an intuitive impression of the value distribution, reveal patterns, and direct your focus. As a general rule of thumb, the charts in graphic tables serve as a guide while the numbers make you think. The graphic elements adapt to the predefned cell heights and labels stay where they belong.
Due to these stable formats, you can create and update graphic tables automatically. This makes them an ideal tool for highly automated, datadriven reporting with DeltaMaster. We call this industrial-style reporting because, similar to industrial manufacturing, it standardizes many steps and produces reports at low costs in consistently high quality.


